Monitoring
Frappe Cloud logs a lot of data while your site is running like Request Logs, Site Logs, CPU Time, etc.
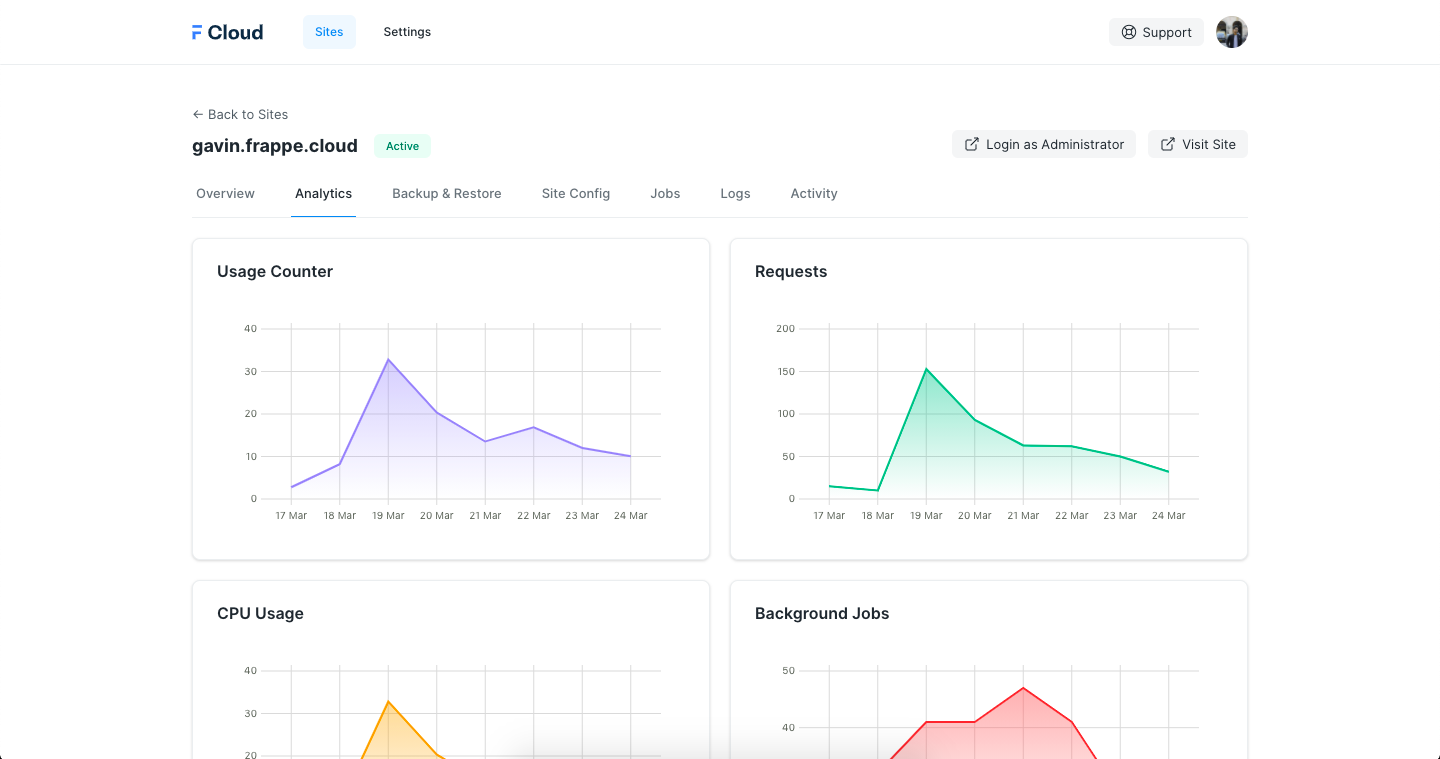
Site Analytics
The Analytics tabs shows a lot of charts:
- Requests - Number of Requests (per minute)
- CPU Usage - CPU Usage of Requests
- Background Jobs - Number of Background Jobs
- Background Jobs CPU Usage - CPU Usage of Background Jobs
- Usage Counter - Cumulative CPU Usage of Requests. You can also see the Daily CPU Time Limit line, you can monitor this chart to know when you need to upgrade your Plan.
- Uptime - Uptime of the web worker and scheduler. Collected every 3 minutes.
Analytics are only available after Setup Wizard is completed. Uptime status is collected every minute.
Investigating high usage
Primarily for investigating high usage, you should look at the Requests Duration By Path and Background Job Duration By Path graphs. This will give you an idea of which endpoints in your site take most time/requests.
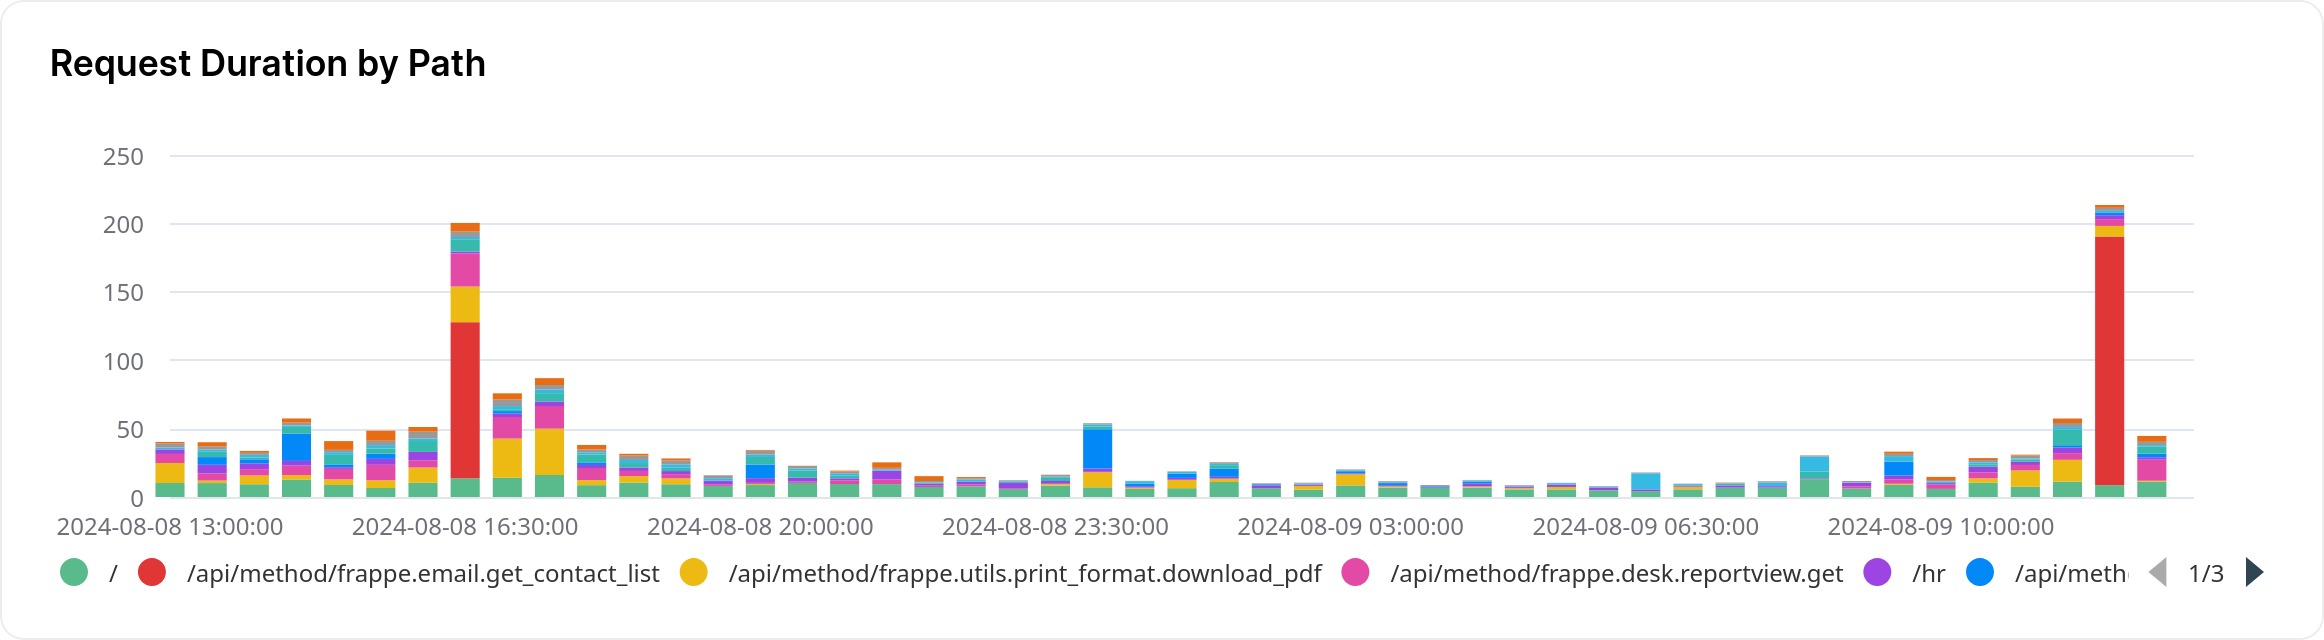
Here, the red bars are seem to take relatively long and should be looked into.
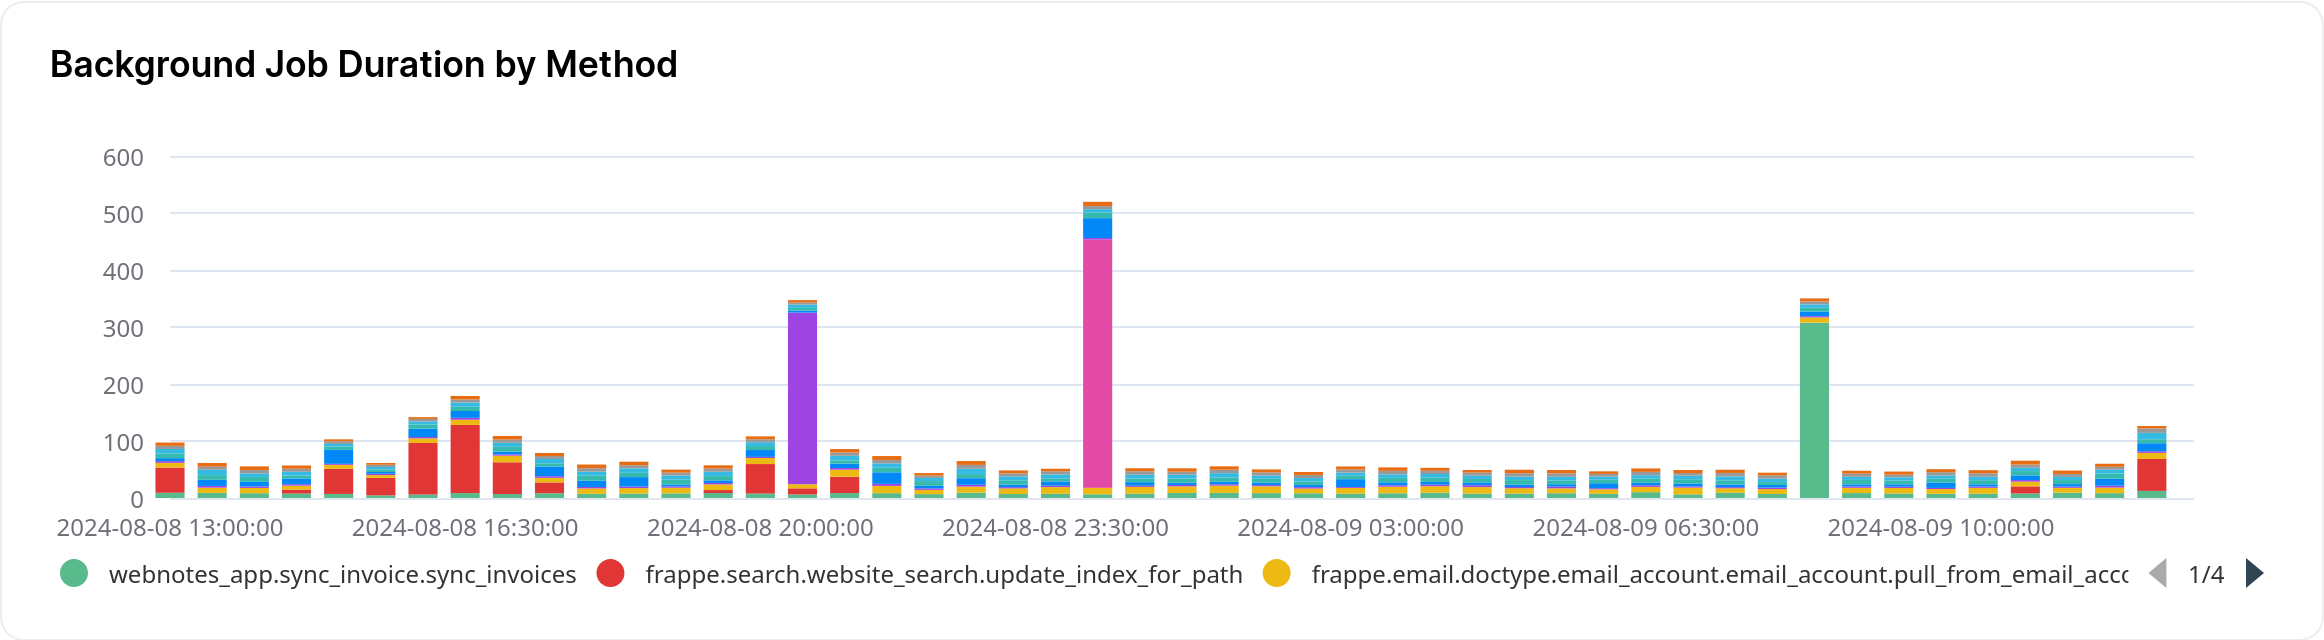
It is sorted in descending order, so the first endpoints in the list are usually slowest.